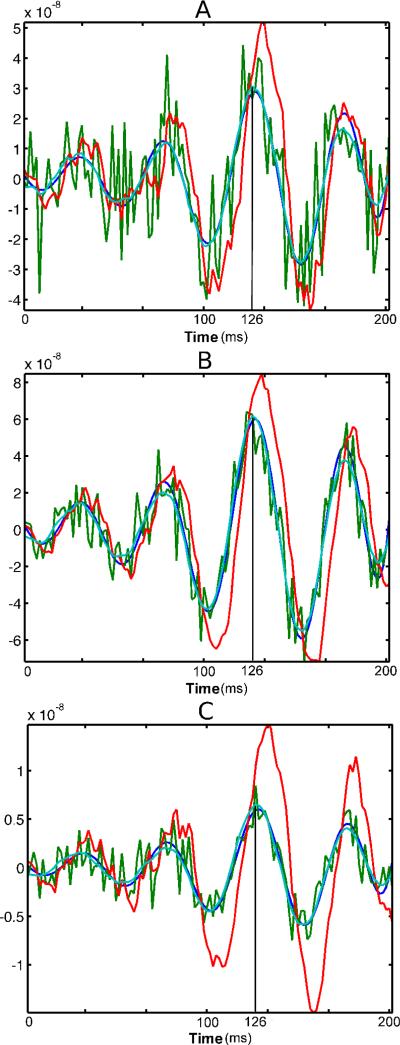
Fig. 2.
Time course of source estimates from the simulated MEG experiment for the maximally responding voxel relative to the MNE solution, where each panel (from top to bottom) corresponds directly to each of the three regions, A, B and C denoted in Figure 1(a). Green denotes the MNE solution, red the KF, dark blue is the FIS solution, while cyan represents the true signal.

