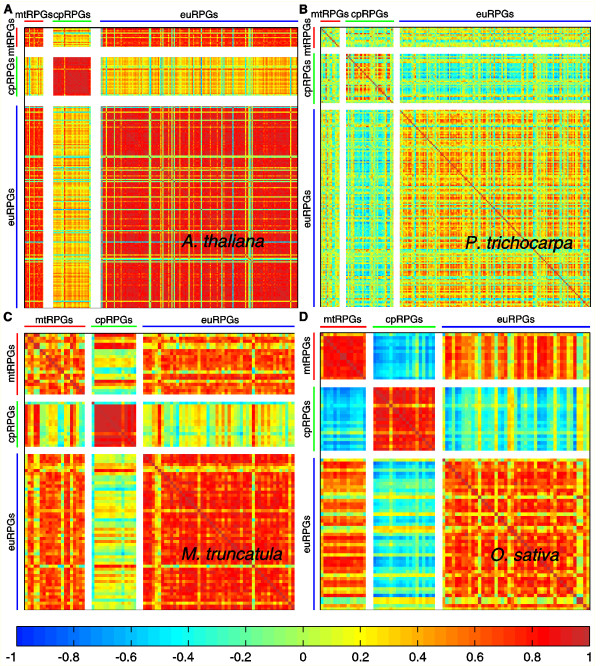
Figure 1.
Correlation between mRNA expression of mtRPGs, cpRPGs and euRPGs in four angiosperms. The expression profiles of RPGs of A. thaliana (A), P. trichocarpa (B), M. truncatula (C) and O. sativa (D). Each element of the matrix represents the Pearson's correlation coefficient between the expression profiles of two RPGs. Color code is illustrated at the bottom panel.

