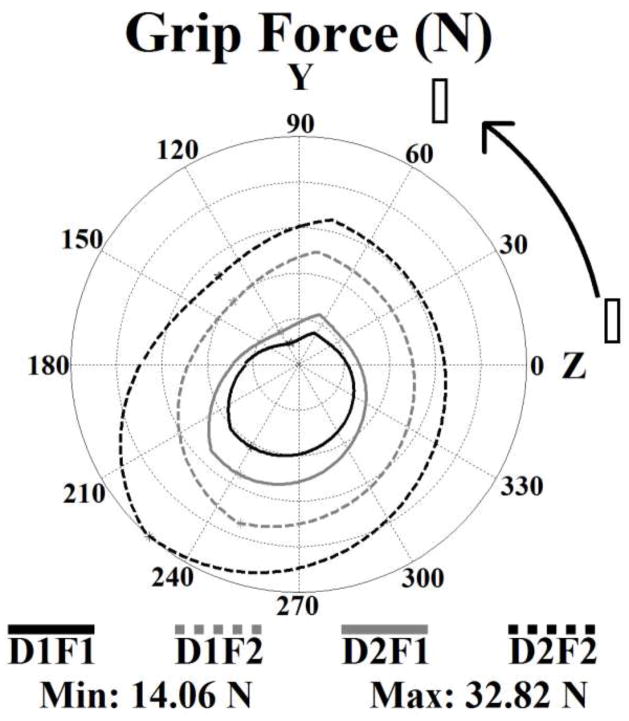
Figure 3. Grip Force: Diameter and Frequency Changes.
Grip forces averaged to one cycle for a single subject (#4) in the sagittal plane movements. D1F1(black): 20cm 1.0Hz, D1F2(grey-dashed): 20cm 1.5Hz, D2F1(grey): 40cm 1.0Hz, D2F2(black-dashed): 40cm, 1.5Hz. The graph is scaled from min (center) 14.06N to max 32.82 N.

