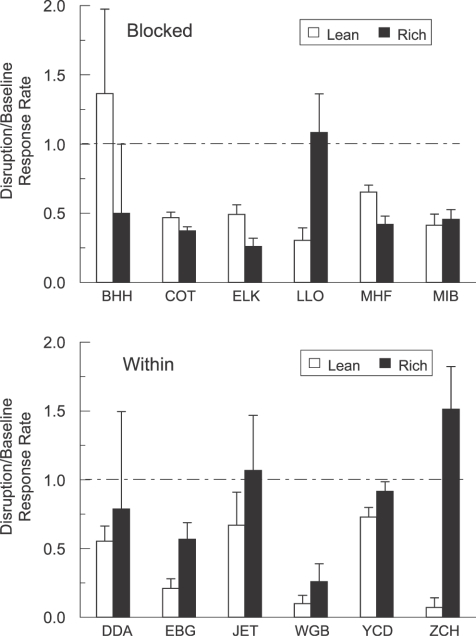
Fig 2.
Mean disruption/baseline response rate ratios during disruption with the alternative stimulus for individual subjects. The dashed line at 1.0 indicates equal responding in baseline and disruption. Whiskers on each bar represent standard error of the mean. Responses to the alternative stimulus are not shown.

