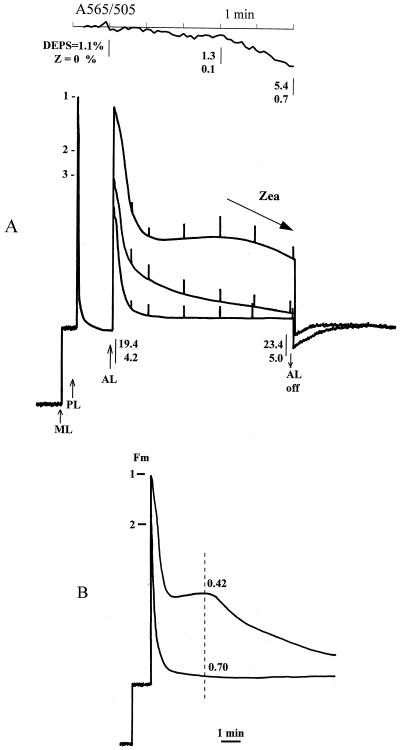
Figure 1.
A, Chlorophyll fluorescence traces and A505 measured on a spinach leaf. Plants were dark adapted for 24 h and given 5 min of actinic illumination (800 μm PAR m−2 s−1), followed by 10 min of dark adaptation to allow recovery of the fast qN (qE) component. 1, 2, and 3 indicate Fm′ before each illumination cycle. Fv /Fm (or Fv ′/ Fm′) before each run was 0.8, 0.75, and 0.7, respectively. For clarity, only the initial fluorescence and the effect of the initial saturation pulse for the first trace and only the initial fluorescence recovery after the first and third illumination are shown. ML, Measuring beam light; PL, light-saturation pulse; AL, actinic light. Also shown are the DEPS and zeaxanthin (Z) percentages of the total carotenoid content taken at the time intervals indicated by the open arrows. This was done repeatedly for a number of different leaves and averaged. The experimental error was not greater than 15%. A505 was measured simultaneously with the first fluorescence-quenching cycle in differential mode against A565 and is presented as the reversed value (A565 − A505). B, Induction of chlorophyll fluorescence quenching in dark-adapted spinach leaf induced by actinic light of 5000 μm PAR m−2 s−1. Horizontal bars and 1 and 2 indicate the Fm before each illumination cycle. Dark-adaptation period between cycles was 15 min. Fv/Fm (or Fv′/Fm′) was 0.79 and 0.70 for the first and second run, respectively. The vertical dashed line indicates a point where qN was calculated as (Fm − Fm′)/Fm, and the value is displayed above each curve.

