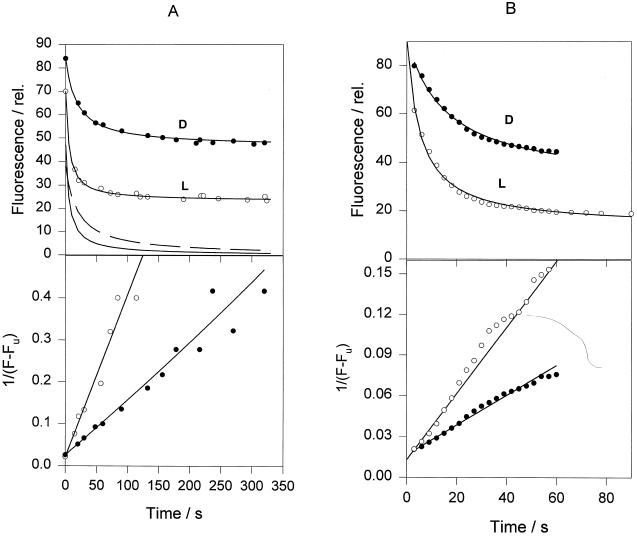
Figure 5.
Analysis of qN kinetics in intact chloroplasts (A) and leaves (B). Actinic light intensity for chloroplasts was 600 μm PAR m−2 s−1, and for leaves it was 5000 μm PAR m−2 s−1. Data were obtained as for Figures 1 and 2. A, Top solid and dashed line at the bottom of the graph are kinetic components derived from the curve-fit procedure for light (L) and dark (D) chloroplasts, respectively. Other details are as described in the Figure 4 legend. Parameter dependencies for chloroplasts and leaves were within 0.11 to 0.5 and 0.5 to 0.9, respectively. The norm was 2.9 for chloroplasts and 5.3 for leaves. The coefficient of variation of parameters was within 1.4% to 4.9% for chloroplasts and 1.9% to 7.4% for leaves. See text for definitions.

