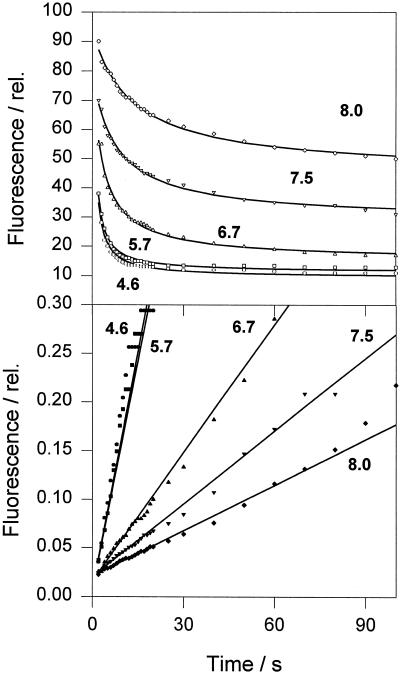
Figure 6.
Analysis of chlorophyll fluorescence quenching kinetics in CP26 induced by acidification. The lines are theoretical curves derived from curve-fitting analysis using two components; the first expresses a second-order reaction and the second is a constant component, Fu. The bottom plot represents a linearization of the experimental and theoretical data from the upper plot using a calculated value of Fu (see Table III). Parameter dependencies were within 0.2 to 0.4, and the norm was 3.0. The average curve-fit error was 1.3%. The coefficient of variation of parameters was within 1.7% to 6.3%. Numbers on the plot correspond to pH values in the incubation medium. See text for definitions.

