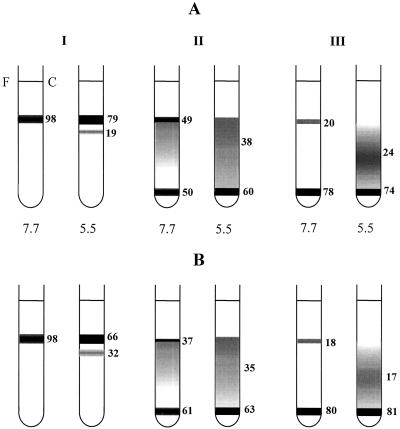
Figure 8.
Suc-gradient centrifugation of LHCII at different pH values and detergent concentrations (I, II, and III correspond to 200, 100, and 15 μm of n-dodecyl β-maltoside, respectively). Numbers beside each tube are the chlorophyll concentration as a percentage of the total. Numbers below each tube are the pH values. A and B correspond to LHCIIb from dark-adapted and light-treated leaves, respectively. Data represent the average from four experiments. The experimental error was within 5%. See text for details.

