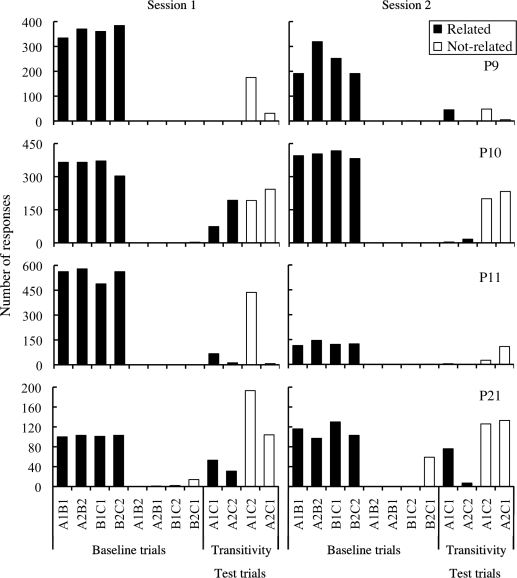
Fig 4.
Number of responses to baseline and transitivity test compound stimuli during transitivity tests for Subjects P9, P10, P11 and P21. The left portion presents the results of Session 1 and the right portion presents the results of Session 2. In each graph, the left portion presents the baseline compounds and the right portion presents the transitivity test compounds. Black columns refer to “related” compounds and white columns refer to “not-related” compounds.

