Figure 3.

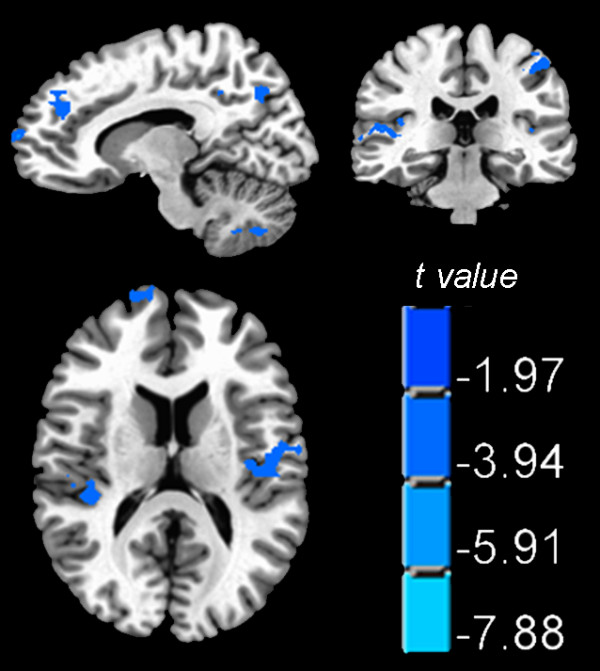
Group comparison on the delay of hemodynamic response. The HA group showed longer delay in multiple regions, particularly at the bilateral insula, which are shown on the axial plane.

Group comparison on the delay of hemodynamic response. The HA group showed longer delay in multiple regions, particularly at the bilateral insula, which are shown on the axial plane.