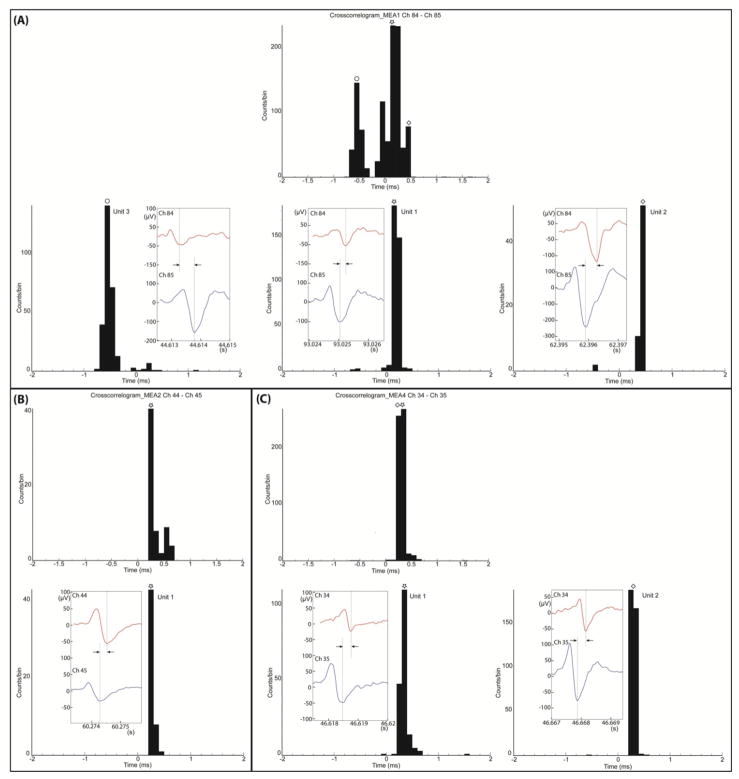
Figure 4.
Analysis of propagation of individual spikes along axons. Results from three electrode-pairs that were on different MEAs. In each box (A, B, C), the upper panel is the cross-correlogram of all individual spikes detected on the two electrodes before spike sorting. The lower panels show cross-correlograms of different identified units extracted from the same electrode-pair after spike sorting. These cross-correlograms of identified units show the distribution of the time delays of spike-pairs. The insets present waveforms for the spike-pairs of the corresponding units. In the insets, the time delays are indicated by the distance between two lines and are consistent with the time values of the peaks of the cross-correlograms. (A) Top panel: cross-correlogram of individual spikes for electrode-pair 84 and 85. (MEA01) before spike sorting. Bottom panels: cross-correlograms and spike-pairs of three identified units. One unit, with negative delay, propagates from Well B to Well A, counter to the expected propagation direction shown by the other units. (B) Top panel: cross-correlogram of individual spikes for electrode-pair 44 and 45 (MEA02) before spike sorting. Bottom panel: a cross-correlogram and a spike-pair of the only identified units of the electrode-pair. For this unit, the propagation is from Well A to Well B as expected. (C) Top panel: cross-correlogram of individual isolated spikes for electrode-pair 34 and 35 (MEA04) before spike sorting. Bottom panels: cross-correlograms and spike-pairs of the two identified units of the electrode-pair. For both units, the propagation is from Well A to Well B as expected.

