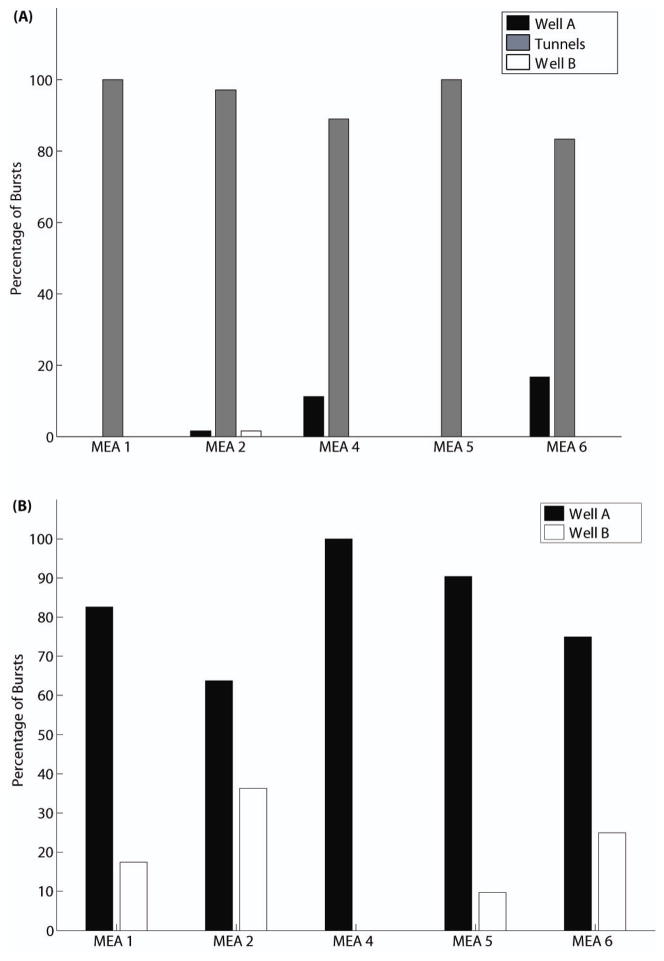
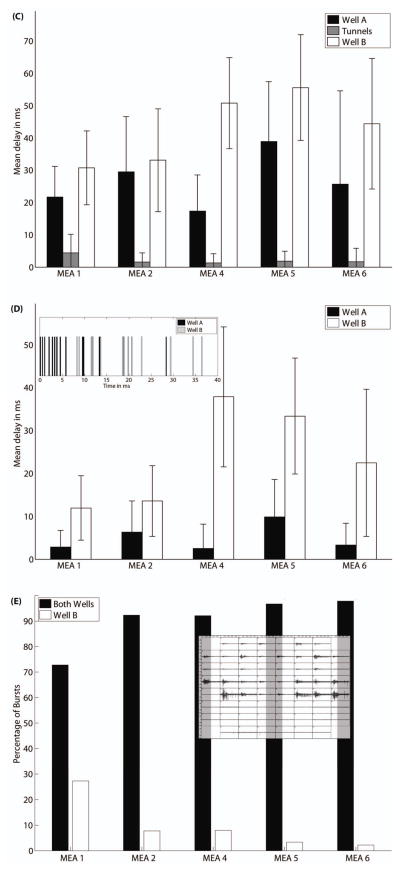
Figure 6.
(A) Percentage of bursts for which the first spike is found in each region for each MEA. (B) Same as A except the signals in the microtunnels are ignored, showing that Well A is the origin of more bursts than Well B. (C) For each region of each MEA, the average delay to the firing times of the next five spikes (group delay). (D) Same as C except the signals in the microtunnels are ignored, showing greater group delay for Well B. The inset is an example to show the temporal sequence of the first spikes of a burst in both wells. (E) The globally propagating bursts in both wells and local bursts only in Well B are compared in percentages for each MEA. The inset shows an example of a local burst from the same MEA from which the global burst in Figure 2(A) comes.


