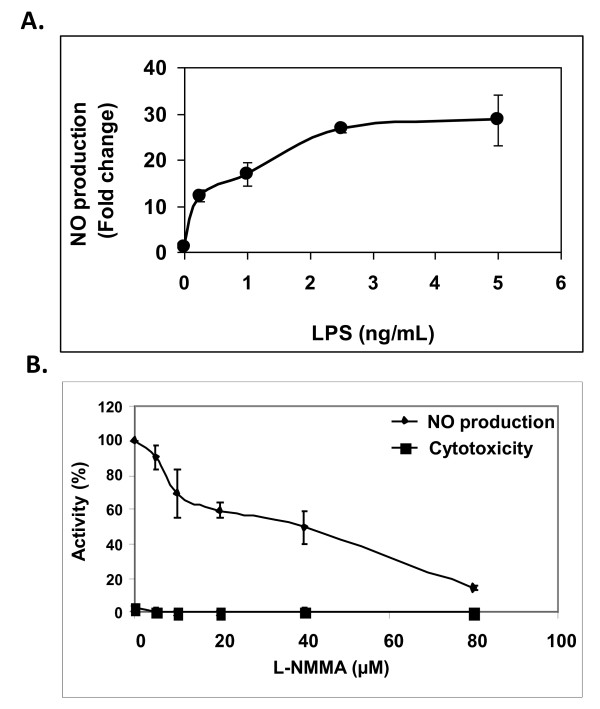
Figure 1.
NO production by LPS-activated primary microglial cells. (A) Microglial cells were stimulated with different concentrations of LPS. (B) L-NMMA was added concomitant with activation by LPS. NO levels in cell conditioned supernatants were measured 20 h later. The results represent means ± SEM of 3 separate experiments (n = 9).

