Figure 3.
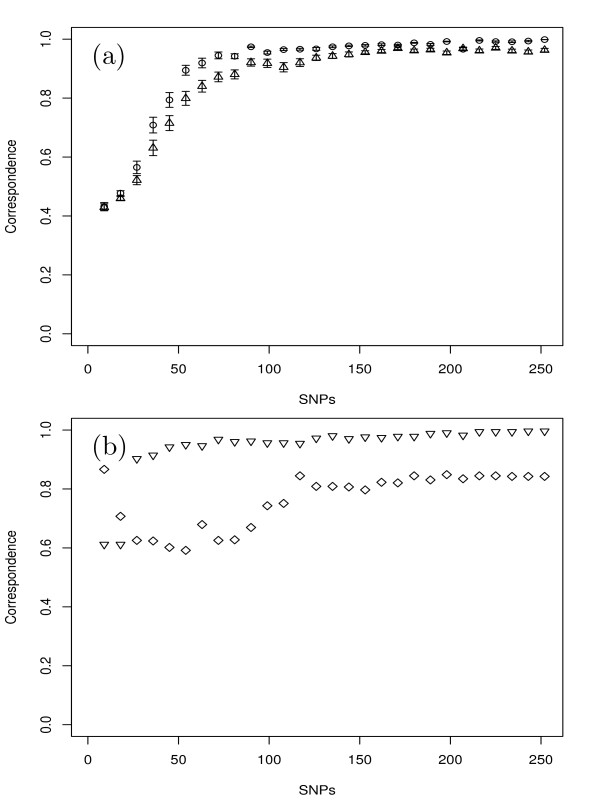
Correspondence between the assignment of all 502 inbreds based on the entire set of 328 SNPs by applying MCLUST on 10 principal components and different subsets of SNP markers selected (a) at random (triangles point-up) or stratified (circles) with 100 replications, and (b) showing high modified Roger's distance (MRD) between sugar and yield type inbreds (square) or highest polymorphic information content (triangles point down). The vertical lines at each point indicate the standard error. For details see Materials and Methods.

