
Figure 16.
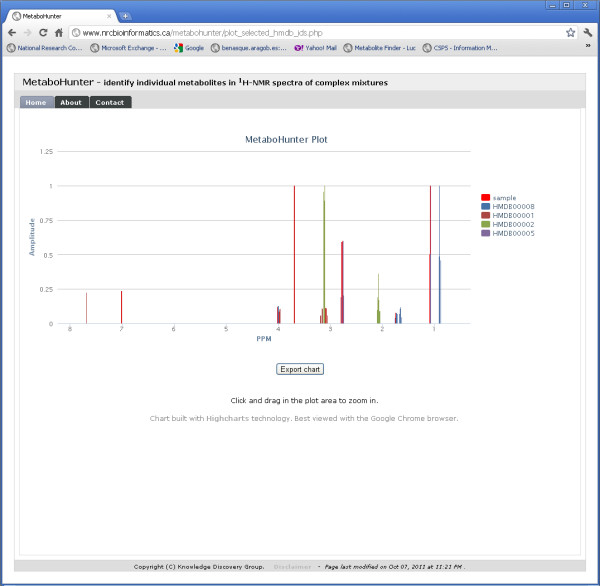
MetaboHunter screenshot for the Plot View. The figure shows MetaboHunter's Plot View, which lists on the left the selected metabolites, while the plot on the right shows the location of the selected metabolite peaks with respect to the sample peaks. The "Export chart" button at the bottom of the plot allows users to save the plot as a PDF file.