Figure 4.

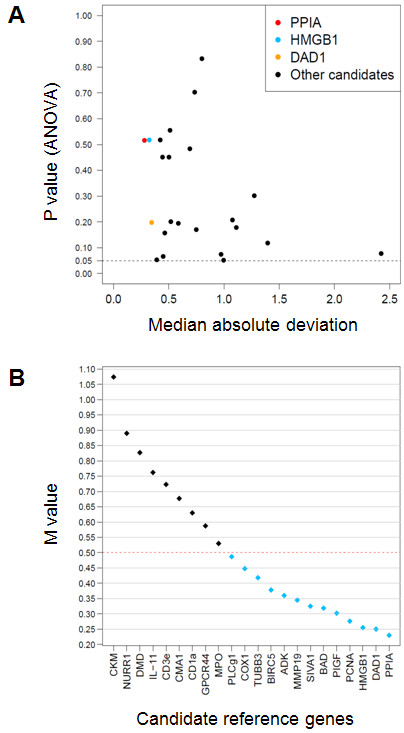
Identification of candidate reference genes. A. Median absolute deviation from the median (MAD) of 23 genes which were identified with ANOVA as "not regulated" (p ≥ 0.05) is plotted against the p values determined by ANOVA. Genes possessing low MAD but high p values (p >> 0.05) would constitute candidate reference genes. The three genes with the lowest MAD are identified by red (PPIA), orange (DAD1) and light blue (HMGB1) dots. The dotted line represents the p value threshold of 0.05. B. geNorm analysis of the same 23 genes as in A. The final output contains 22 genes since geNorm excluded IFN-γ due to excess missing values. The y-axis represents the average expression stability (M value) of the remaining 22 genes. PPIA, DAD1 and HMGB1 have the lowest M values and constitute the best candidate reference genes. Abbreviations: ADK, adenosine kinase; BAD, Bcl associated death promoter; BIRC5, baculoviral IAP repeat containing 5; CKM, creatine kinase (muscle); CD3e, cluster of differentiation 3, ε subunit; CD1a, cluster of differentiation 1a; CMA1, mast cell chimase; COX1, cyclooxygenase 1; DAD1, defender against cell death 1; DMD, dystrophin; GPCR44, G-protein coupled receptor 44; HMGB1, high mobility group B1; IL-11, interleukin 11; MMP19, matrix metalloproteinase 19; MPO, myeloperoxidase; NURR1, nuclear receptor related 1; PCNA, proliferating cell nuclear antigen; PIGF, phosphatidyl inositol glycan anchor biosynthesis, class F; PLCg1, phospholipase C γ1; PPIA, prolylpeptidyl isomerase A; SIVA1, SIVA1 apopotosis-inducing factor; TUBB3, tubulin β3.
