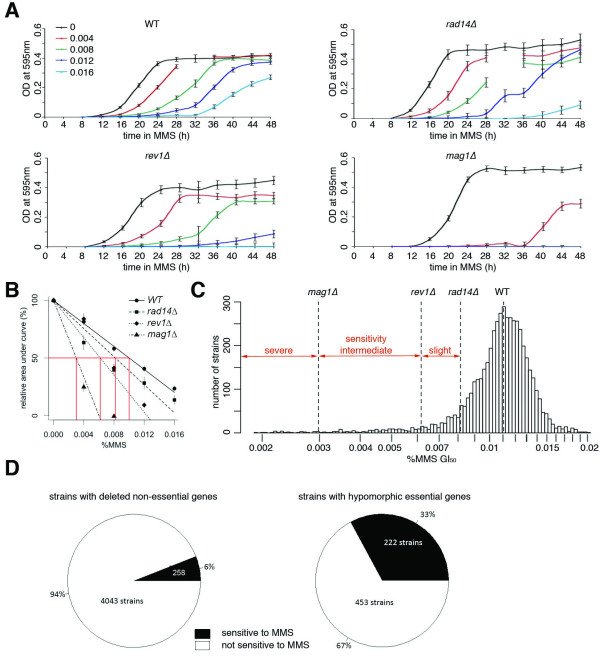
Figure 2.
Determination of sensitivity phenotype of the tested strains. A) Growth curves of the controls - WT and the sensitive strains rad14Δ, rev1Δ, and mag1Δ - during 12-48 h after insult with increasing doses of alkylating agent MMS. A few data points at 32 h were undersampled and showed large variation. These points were omitted from the graphs. B) The area under the growth curves were plotted against the dose to calculate the dose that result in 50% growth inhibition (GI50). The data for the four control strains are shown. Error bars represents the s.e.m. C) Histograms of showing the distribution of GI50 from the entire tested panel (both deletion and DAmP strains), with the GI50 of the four control strains forming the limits between severe, intermediate and slight sensitivity to MMS. The WT strain has been transfected with a plasmid conferring G418 resistance that alters the sensitivity of the strain slightly. D) Pie charts of sensitivities of the strains lacking (left) non-essential genes (deletion strains) and (right) essential genes (DAmP strains).

