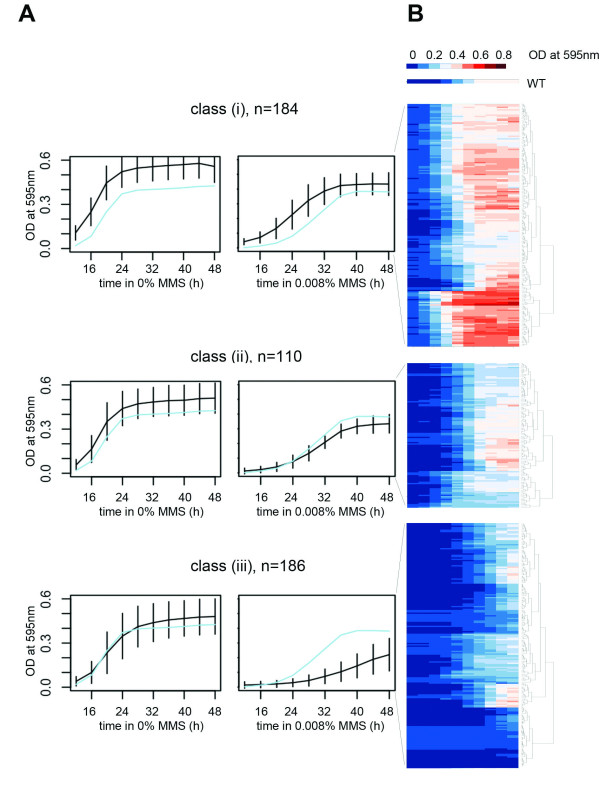
Figure 5.
The strains with intermediate sensitivity are divided into classes based on their growth phenotype after exposure to 0.008% MMS. A) Through self-organizing maps, three classes were identified based on the growth curves after MMS exposure. WT is shown as a reference in light blue. The black lines show the average values within the class for each time point. B) Hierarchical clustering and heatmaps of the three clusters in A. The growth of the WT strain is shown at the top.

