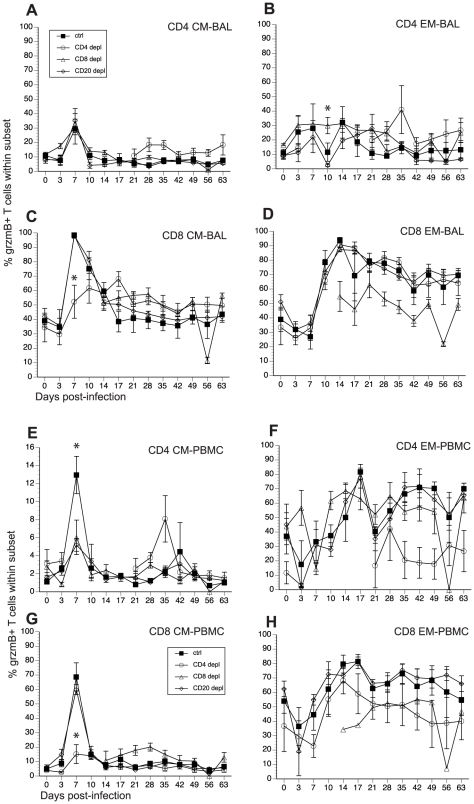
Figure 7. Frequency of granzyme (grzm) B+ T cells after SVV infection.
Frequency of grzmB+ T cells within CD4 and CD8 CM and EM subset was assessed by FCM in BAL (A–D) and PBMC (E–H). Average percentages of grzmB+ cells ± SEM are shown. Data points for CD4 T cell grzmB+ frequency in CD4-depleted animals are not shown 7–21 dpi as the frequency of CD4 T cells in circulation was too low during this time period. Similarly, data points for grzmB+ CD8 T cell frequency are not shown 0–14 dpi as there were no CD8 T cells detected during this period. * indicates p<0.05 as compared to control animals.

