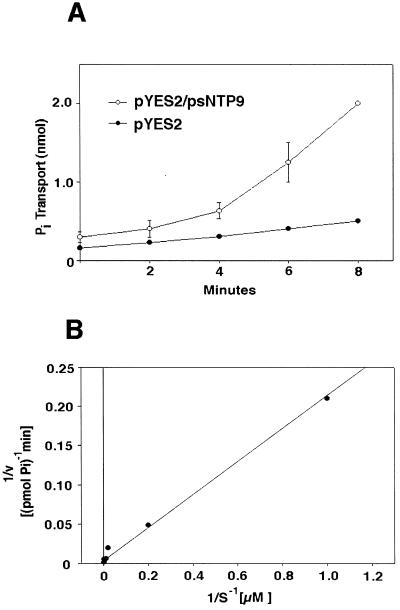
Figure 2.
Pi uptake by NS219 in the presence and absence of the psNTP9 gene. A, Two independent pYES2/psNTP9 transformants were tested. Values reported are in nanomoles per milliliter and are the averages of duplicate samples. B, Lineweaver-Burk plot of Pi uptake versus the Pi concentration of the culture medium. Linear-regression analysis was used to fit the data and a first-order polynomial describing the line of best fit was used to approximate the Km.

