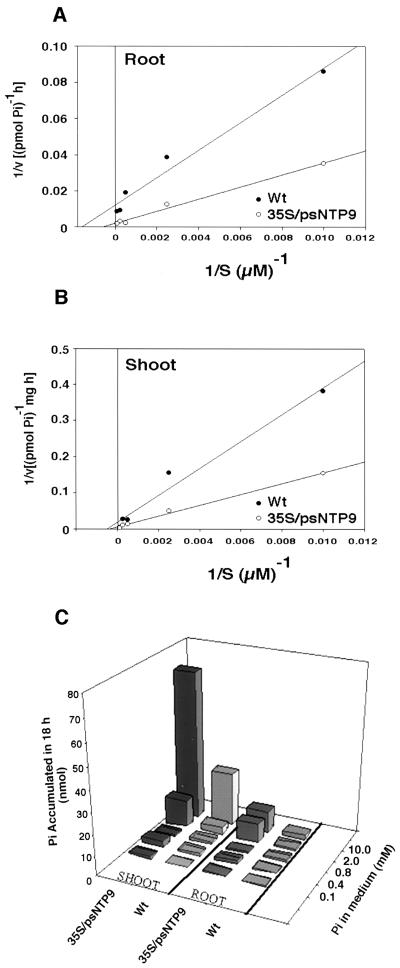
Figure 4.
Kinetic analysis of Pi uptake into wild-type (Wt) and transgenic Arabidopsis plants. A, Lineweaver-Burk plot of Pi uptake into roots. Values on the x axis are the averages of Pi accumulated per minute for three transgenic and three wild-type roots at each of the five Pi concentrations tested. Linear-regression analysis was used to fit the data, and a first-order polynomial describing the line of best fit was used to approximate the Km. B, Lineweaver-Burk plot of Pi uptake into shoots. The data were acquired and analyzed in the same manner as for the root kinetics but were normalized for weight because of the differences in shoot size. C, To permit comparisons between the uptake of shoots and roots, the total Pi accumulation during the 18-h experiment is presented for each tissue. For each concentration the average uptake of the three plants is presented.

