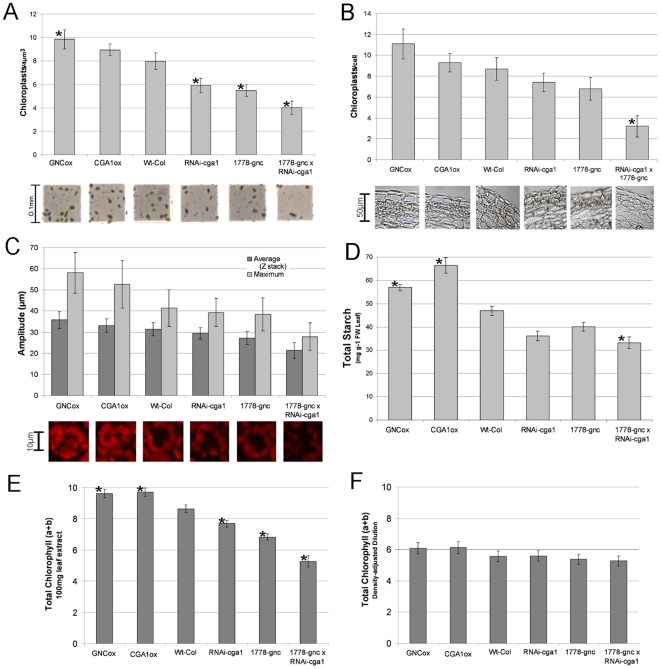
Figure 6. Chloroplast number and leaf starch in GNC and CGA1 transgenics.
A) Quantification of chloroplast numbers using hemocytometer following extraction from 100mg of rosette leaf tissue. B) Number of chloroplasts in chloroplast containing cells of the inflorescence from mature plants. Values are an average of counts from consecutive wax embedded sections taken from multiple plants from each line (n>3). C) Confocal microscopy of leaf tissue measuring auto-fluorescence of chlorophyll molecule. Images show obvious differences in chloroplast number between with changes in GNC and CGA1 expression. D) Starch measured from leaf material of 3 week old plants. Transgenic lines were compared to wild-type using the Megazyme Total Starch Assay kit. E) Chlorophyll quantified from chloroplasts extracted from 100mg leaf tissue using acetone based extraction. F) Chlorophyll quantified using acetone based technique following the application of a dilution factor to the extracted chloroplasts based on chloroplast counts. (All data are MEAN+SD, p<.05, t-test).

