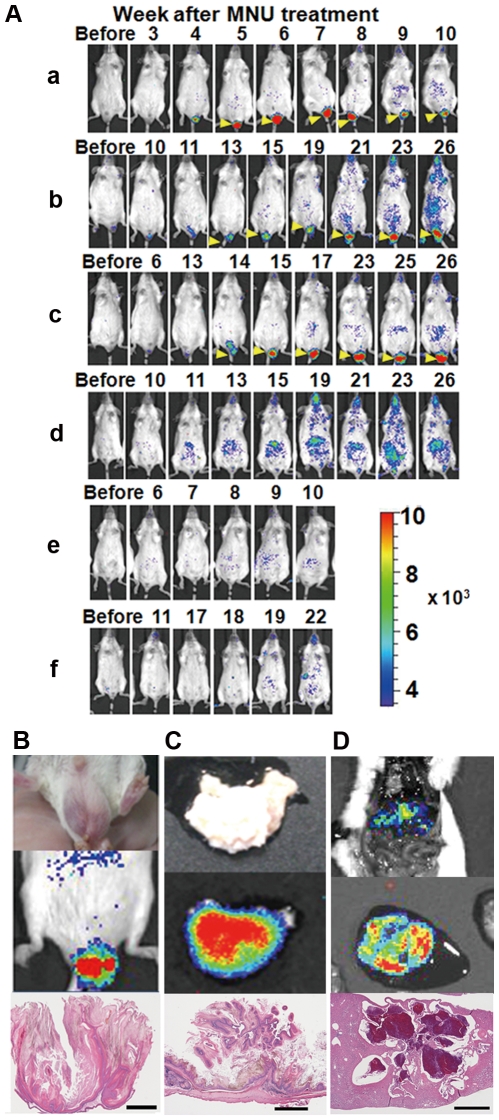
Figure 4. In vivo bioimaging of cancer formation.
(A) Double (Ras+HOL+) transgenic mice were peritoneally injected with MNU and bioluminescence images were acquired every week. Bioluminescent signals from the papilloma of the scrotum are indicated by yellow arrowheads. (B) Brightfield image (upper left), in vivo bioluminescence image (upper right), and tumor section (bottom) of the squamous cell papilloma of the scrotum from mouse c. (C) Brightfield image (upper left), ex vivo bioluminescence image (upper right), and tumor section (bottom) of the squamous cell papilloma/carcinoma of the stomach from mouse b. (D) Ex vivo bioluminescence image (upper) and the tumor section (bottom) of the hemangioma of the liver from mouse c. bar = 1 mm.

