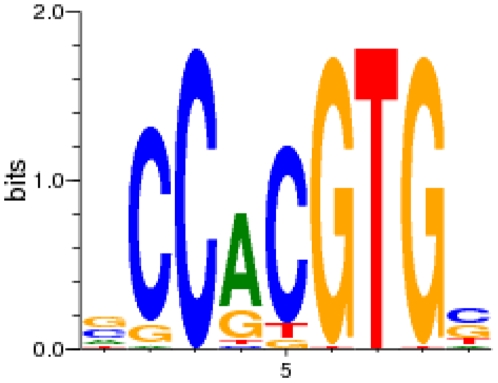
Figure 3. Sequence logo for the de-novo calculated MYC.01-binding site.
The transcription factor binding matrix (Table S6) was generated by CoreSearch using the top 100 sequences of MYC genomic intervals (Table S5). A typical E-box motive (CACGTG) was obtained. Highly conserved positions are represented by higher stacks of base symbols A, C, G, and T than less conserved positions. The relative frequencies of the corresponding bases at each position are represented by the relative heights of the symbols within in each stack.

