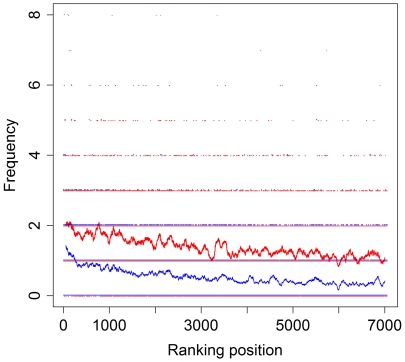
Figure 4. Frequency of MYC-binding sites in comparison to the ranking position of the 7,054 genomic intervals.
Y-axis: Frequency of the MYC.01-binding matrix (blue line) and the Genomatix E-box matrix family (red line). X-axis: Ranking position of the 7,054 genomic intervals (Table S5). A moving average with a window size of 100 ranks was used.

