
Figure 2.
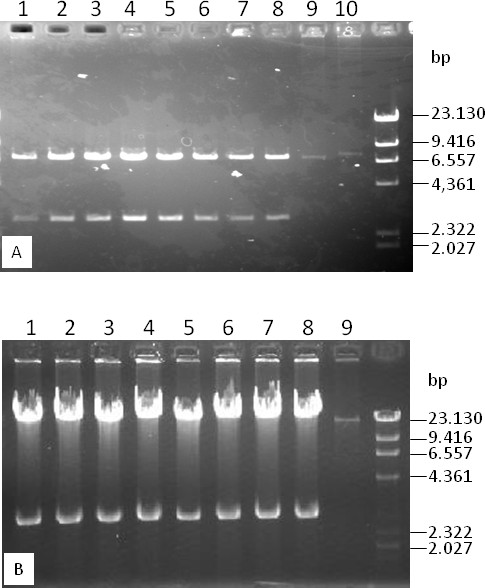
DNA analyses of randomly picked colonies showing copy number increases of the composite vectors pHZAUBAC1 and pHZAUBIBAC1. A. DNA analysis of randomly picked colonies transformed with pIndigoBac536 (lane 10), pIndigoBac536-S (lane 9) and the ligation product of pIndigoBac536-S and pGEM-4Z at the HindIII cloning site (pHZAUBAC1, lanes 1-8). DNA samples were prepared from 2 mL overnight cultures and were resuspended in 50 μL TE. Aliquots of 5 μL were digested with HindIII and were loaded onto a 1% agarose gel. pIndigoBAC536-S is 470 bp smaller than pIndigoBAC536. B. DNA analysis of randomly picked colonies transformed with BIBAC-S (lane 9) and the ligation product of BIBAC-S and pGEM-4Z at the BamHI cloning site (pHZAUBIBAC1, lanes 1-8). DNA samples were prepared from 2 mL overnight cultures and were resuspended in 50 μL of TE. Aliquots of 5 μL were digested with BamHI and were loaded onto a 1% agarose gel. The marker is lambda/HindIII.