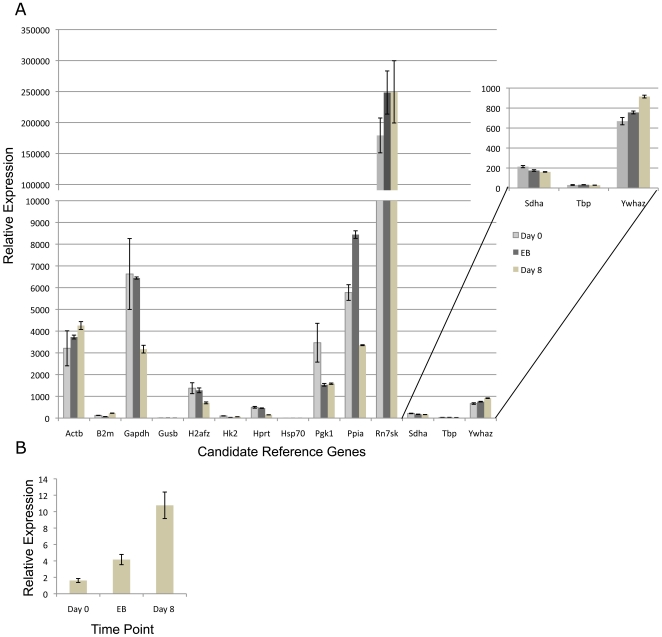
Figure 3. A. Relative expression of the fourteen candidate genes throughout differentiation of all three genetic backgrounds of ES cells examined.
CT values for each transcript were measure on Day 0, Day 4 (embryoid body) and Day 8 and were then normalized to the geometric mean of Sdha Tbp and Ywhaz. Relative values were determined using methods described previously [13], [34], [35] and graphed. Error bars represent the standard error of the mean. B. Increased expression of fibroblast specific protein 1 throughout ES cell differentiation. Error bars represent the standard error of the mean for three independent replicates.

