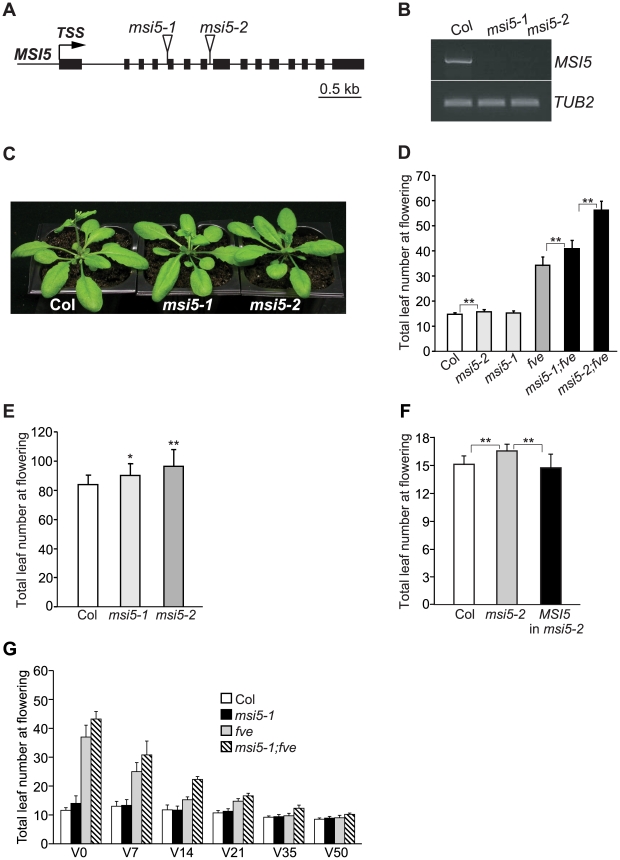
Figure 1. Characterization of msi5 Mutants.
(A) MSI5 gene structure. Exons are represented by filled boxes, and the transcription start site (TSS) is indicated with an arrow. Triangles indicate T-DNA insertion sites. (B) RT-PCR analysis of the full-length MSI5 transcript levels in msi5 mutant seedlings. TUBLIN2 (TUB2) serves as the endogenous control. (C) msi5 mutants grown in LD. (D) Flowering times of the indicated genotypes grown in LD. Double asterisks indicate statistically significant differences in the means between indicated genotypes as revealed by two-tailed Student's t-test (**, P<0.01). (E) Flowering times of msi5 mutants grown in short days. Asterisks indicate statistically significant differences in the means between msi5 mutants and Col (*, P<0.05; **, P<0.01). (F) Complementation of the msi5-2 allele by the wild-type MSI5 gene. Flowering times of Col, msi5-2 and msi5-2 carrying the wild-type MSI5 (T1 generation) grown in LD, were scored. Asterisks indicate statistically significant differences in the means between indicated genotypes. (G) Effects of cold treatments on the flowering times of the indicated genotypes grown in LD. Seedlings were treated at 4°C; “V” indicates days of cold treatment before the plants returned to normal growth condition. (D–G) Flowering times are expressed as the total number of primary rosette and cauline leaves at flowering; for each genotype, at least 10 plants were scored. Error bars indicate standard deviation (SD).

