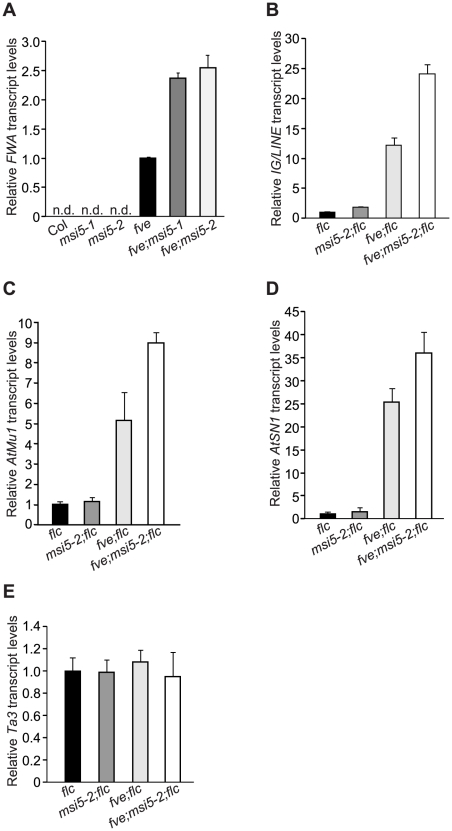
Figure 3. MSI5 Acts Redundantly with FVE to Silence Endogenous RdDM Target Loci.
(A) Relative FWA mRNA levels in the seedlings of indicated genotypes, quantified by real-time RT-PCR. Relative expression to the fve mutant is presented. “n.d.” indicates that FWA transcript levels were too low to be detected. The transcript levels were normalized to the endogenous control TUB2. Bars indicate SD. (B–E) Relative transcript levels of IG/LINE (B), AtMu1 (C), AtSN1 (D) and Ta3 (E) in the seedlings of indicated genotypes as quantified by real-time PCR. Relative expression to the flc mutant is presented. Bars indicate SD.

