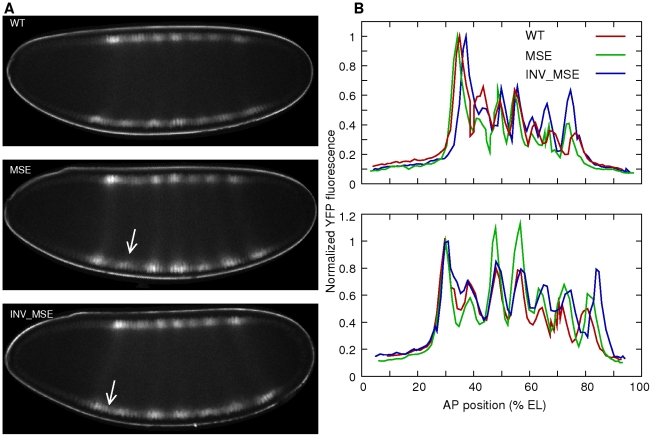
Figure 4. Eve-YFP expression in WT, MSE, and INV_MSE embryos.
A. Sample embryos expressing Eve-YFP just prior to gastrulation. The expression patterns correspond roughly to mid cycle 14 Eve expression observed in fixed tissue [36], implying that the time required for YFP maturation induces a 15–20 min delay. Stripe 2 is weaker in MSE and the anterior border is derepressed in INV_MSE (arrows). Anterior is to the left and dorsal is up. B. Raw quantitative Eve-YFP expression data extracted from the dorsal (top) and ventral (bottom) nuclei of the images shown in panel A. The y-axis is the mean fluorescence intensity in a nucleus and the x-axis is the anteroposterior (AP) position of the nucleus. The expression values are normalized to the peak of stripe 1. Both dorsal and ventral profiles show the mutant phenotypes. The ventral profiles exhibit a more mature Eve pattern than the dorsal ones. The other stripes are brighter relative to the first, and stripes 5 and 6 are more resolved. Anterior is 0% egg length (EL).

