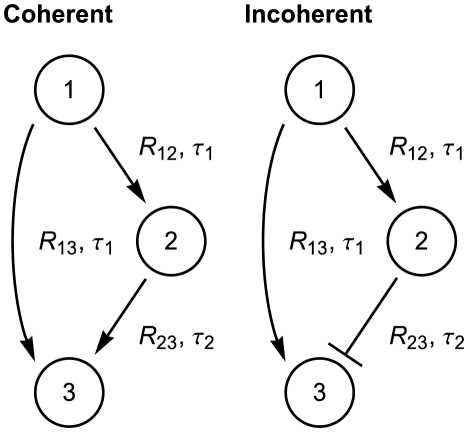
Figure 3. Network schematics for the coherent and incoherent feedforward loops.
Each pathway in the networks has an associated signaling threshold ( ) and mean delay time (
 ). The random time between the initiation of transcription of gene
  to the full formation of a total of
  proteins
  is denoted
  , which is an implicit function of
  .
.

