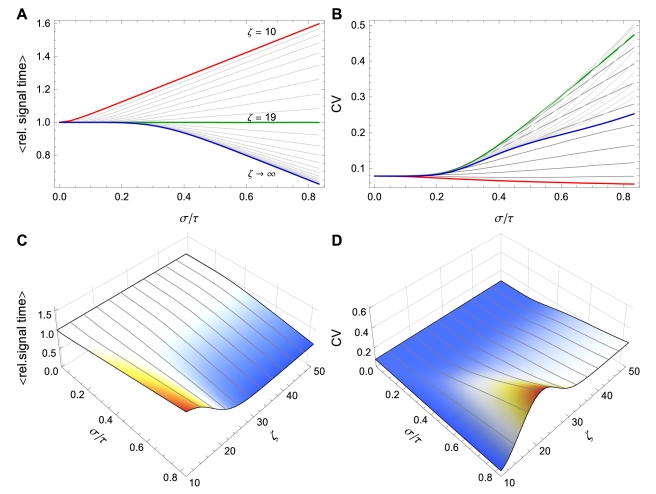
Figure 7. Signaling time depends on the number of initiation events.
 can increase or decrease as a function of
  depending on the value of
  . Here
  . (A)
. (A)  vs. CV of
  for
for  varying from
  (red) to
  (green) to
  (blue) using the Bernoulli delay distribution
  in Example with
  . Note the transition that occurs at
  . (B) Equivalent to (A), but plotting CV of the signaling time instead of conditional expectation. (C) and (D) Contour plots corresponding to (A) and (B), respectively. Notice that for fixed
  , signaling time CV can change non-monotonically with
  . For instance, at
  , signaling time CV starts low (red), increases to
  (green) and then decreases thereafter. Plots were obtained through stochastic simulation with
  trials.

