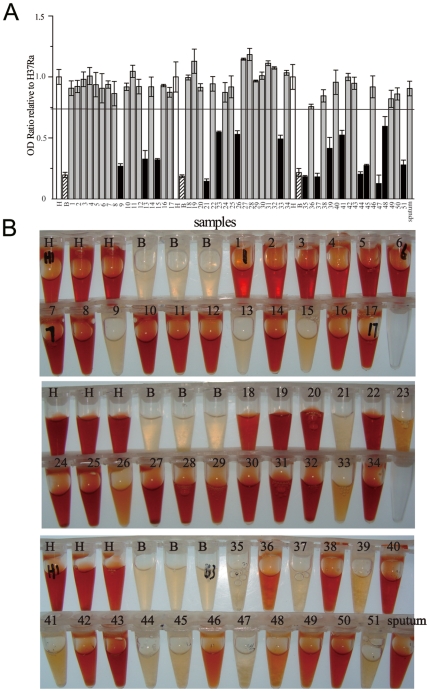
Figure 3. In-vitro synthesized PZase activities of clinical samples.
A. OD ratios of samples relative to M. tuberculosis H37Ra. The samples with their OD ratios relative to M. tuberculosis H37Ra below the cutoff were marked as black bars (PZA resistant). The samples with their OD ratios relative to M. tuberculosis H37Ra above the cutoff were marked as gray bars (PZA susceptible). H: M. tuberculosis H37Ra, white bars; B: M. bovis BCG, hatched bars.Sputum: sputum sample. Clinical isolates are labeled with their specimen No. B. Pictures of in-vitro synthesized PZase activities of all the clinical samples. H: M. tuberculosis H37Ra; B: M. bovis BCG. Sputum: sputum sample. Clinical isolates are labeled with their specimen No.

