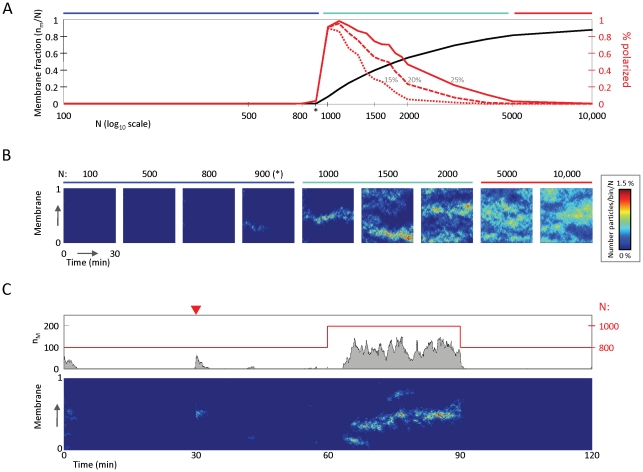
Figure 2. Repression, emergence, and loss of polarity for increasing concentrations of signaling molecules.
(A) Three regions of polarization behavior are shown: repression (blue bar); spontaneous emergence (cyan bar) and loss (red bar);. Black curve: averaged membrane fractions of molecules. Red curves: averaged probabilities of observing polarization; signaling molecules are considered clustered when more than 20 molecules are present on the membrane, and 50% of all molecules on the membrane are within a small region covering 15% (dotted curve), 20% (dashed curve), or 25% (solid curve) of the membrane. (*) indicates critical number of molecules  . Results are averaged of 50 simulations, performed for each indicated value of
  . Changing the minimum cluster size to 10 molecules from 20 does not affect results (not shown). (B) Kymographs of simulations for values of
  chosen from the three regions shown in (A). (C) Positive feedback circuits give rise to switch-like behaviors in time and space. 0 min: the positive feedback circuit is initialized with
  molecules, 10% of which are randomly distributed on the membrane, and polarity is repressed (
 ); 30 min (red triangle): 10% of the cytosolic molecules are reseeded to 10% of the membrane; 60 min: 200 particles are added to the cytosol, and polarity switches on (
 ); 90 min: 200 particles are removed from the cytosol and polarity switches off. Bottom panel: kymograph of simulation is as in (B); top panel: total number of molecules on membrane (gray curve and left axis) and total number of molecules in cell (red curve and right axis). Simulations were performed on a 1-D circular membrane (see Table 3 for model parameters).

