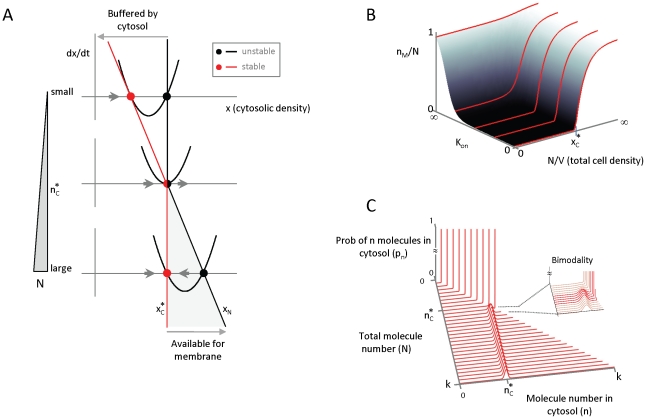
Figure 3. Polarity is repressed below a critical total density of signaling molecules.
(A) Illustration shows stability of equilibrium values for cytosolic densities,  and
and  , for varying
  when
when  . Red: stable root; black unstable root. (B) Shown is equilibrium membrane fraction
  of signaling molecules on the membrane
  for various cell densities and different values of
  . Cytosolic buffering occurs when
  is nearly zero. (C) The probability,
  , that the: cytosol contains exactly
  molecules is shown for different total molecule numbers,
  , scanned between 0 and
  . Steady state probabilities of molecule numbers in the cytosol are computed from stochastic master equation (Protocol S1). Inset: zoom-in of transition region showing bimodality of probability distribution.

