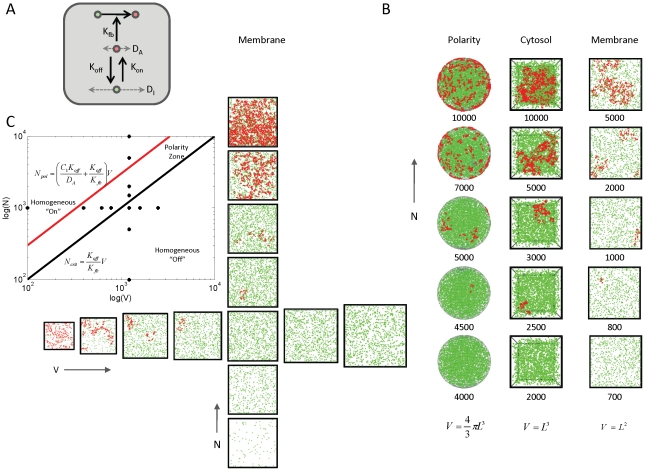
Figure 5. Density-dependence of spatial clustering is observed for different spatial geometries.
(A) Modification of model shown in Figure 1B, removing the assumptions that the active and inactive molecules are spatially segregated into different spatial compartments, and that the inactive form is spatially homogeneous (infinite rate of diffusion). Here, both the active (red) and inactive (green) molecules can occupy the same compartment and diffuse at finite speeds given by rates  and
and  , respectively. (B) Numerical implementation of the modified model shown in (A) for three different spatial geometries: (i) active molecules reside on the surface of sphere, while inactive molecules reside in the interior (polarity); (ii) both active and inactive molecules reside in a 3-D volume (cytosol); and (iii) both active and inactive molecules reside on a 2-D surface (membrane). For all geometries, we observe progression from buffered off state to localized clusters to homogeneous on state as the number of molecules is increased. (C) Phase plane diagram for the 2-D model as a function of molecule numbers and membrane area. Numerical simulations using the stochastic molecule simulator Smoldyn illustrate a density-dependent switch in clustering behavior. Inset: analytically computed phase plane diagram; “+” marks indicate locations of simulations; V in equations has dimensions of area (see labels at bottom (B)). All simulations in (B–C) were performed using the Smoldyn stochastic molecule simulator version 2.15 [51]; . Shown are results from running the stochastic simulation for 100 time units (see Protocol S1, Appendix for code and parameter values).

