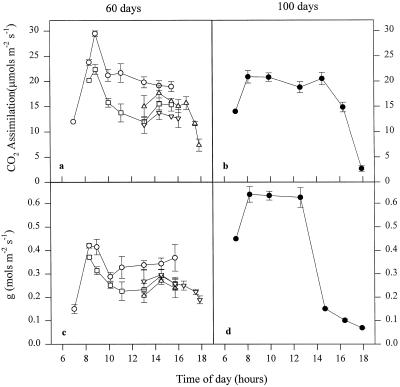
Figure 3.
Daily profiles of photosynthesis (a and b) and stomatal conductance (c and d) for IR65 leaves 60 d (a and c) and 100 d (b and d) following transplanting. ○, •, Face 1 direct; □, face 1 in situ; ▵, face 2 direct; ▿, face 2 in situ. Error bars represent se of at least seven replicates. See text for details.

