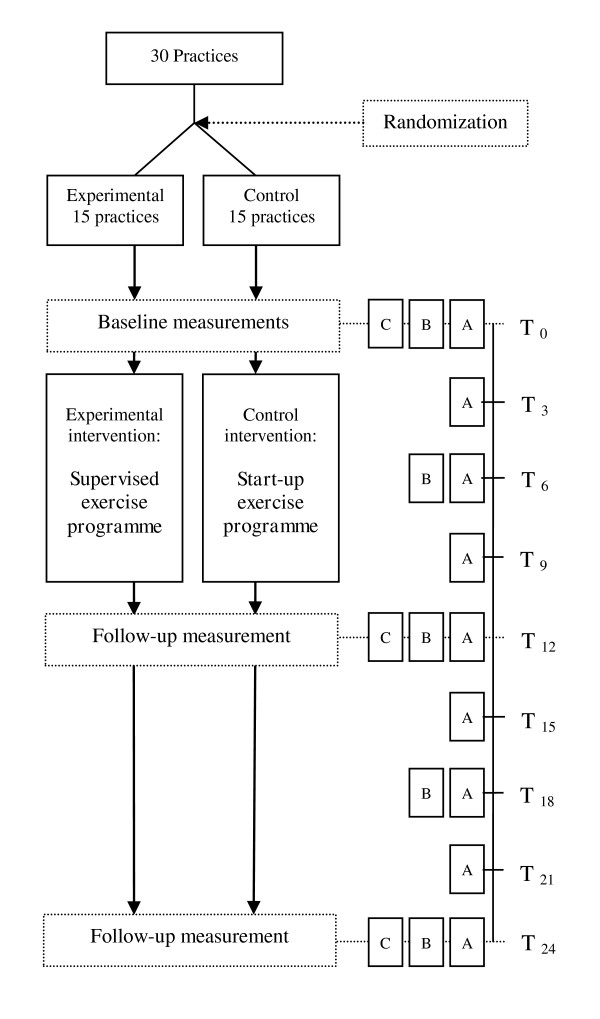
Figure 1.
Flowchart of the 'BeweegKuur' randomized controlled trial and measurements. A. Health care utilisation and productivity losses, EQ5-D and process items in questionnaire every three months; B. Clinical outcomes measured in questionnaire every six months; C. Clinical outcome measurements performed every year. Table 2 shows outcomes in each category. T0-T24 represent moments of measurement. T0 = Baseline; T3 = Three months after baseline; T6 = Six months after baseline; ...; T24 = 24 months after baseline.

