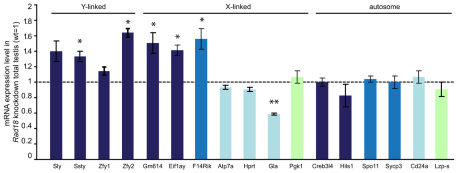
Fig. 5.
Derepression of X- and Y-linked genes in Rad18 KD testis. Real-time RT-PCR quantification of mRNA levels of X-, Y- and autosome-linked genes in total testes from Rad18 KD mice. The amount of PCR products was normalized to mRNA encoding β-actin. The level of mRNA expression in control is set as 1.0, and mRNA expression levels of indicated genes in Rad18 KD testes relative to the control are shown in the graph. Error bars show s.e.m. for two independent experiments from three mice. Dark blue bars indicate genes mainly expressed in postmeiotic cells, blue bars indicate genes mainly expressed in meiotic prophase cells, light blue bars represent premeiotic genes, and the light green bars represent genes that are mainly expressed in somatic cells. *P<0.05 (Mann–Whitney U-test).

