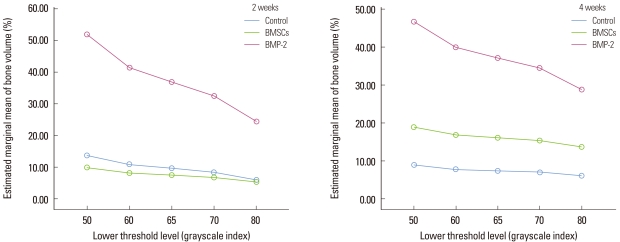
Figure 10.
Illustration of the bone volume (%) measurement of each group at 2 and 4 weeks according to the lower threshold level. The bone morphogenic protein-2 (BMP-2) group showed a sharper decline as the threshold level increased at 2 weeks than the other groups, and the difference was significant (repeated measures analysis of variance [ANOVA], statistically significant, P<0.001). This pattern was similar at 4 weeks (repeated measures ANOVA, statistically significant, P<0.001). The unit of the threshold level was the grayscale index. BMSCs, bone marrow stromal cells.

