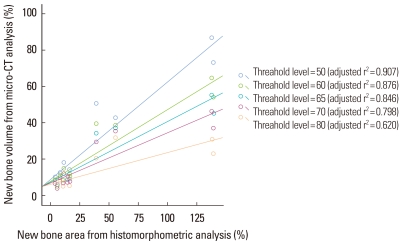
Figure 7.
Scatter diagram and linear regression analysis between new bone area (%) of histomorphometric analysis of a representative section and bone volume (%) of micro computed tomography (micro-CT) analysis at 2 weeks. The correlation between the two analyses was statistically significant (P<0.0001, all groups). As the threshold level was increased, the correlation between the two analyses decreased. At a threshold level of 50, the correlation was the most significant. The unit of the threshold level was the grayscale index.

