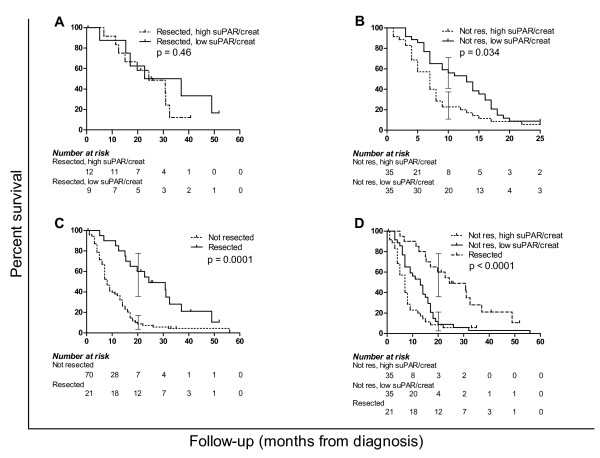
Figure 3.
Univariate survival analysis of pancreatic adenocarcinoma patients. Kaplan-meier analysis of pancreatic adenocarcinoma patients based on surgery and suPAR/creatinine levels; curves compared by Mantel-Cox log-rank test, brackets illustrate 95% CI of survival. A) survival difference between resected patients bearing levels of suPAR/creatinine higher or lower than 9.1 ng/mg (95th percentile of healthy donors) is not significant (p = 0.46). B) Difference in survival between non resected patients according to suPAR/creatinine levels (p = 0.034). C) Survival difference between resected and non-resected patients without considering suPAR/creatinine levels (p = 0.0001). D) Survival of resected vs. non-resected patients with either low or high suPAR/creatinine (log-rank test p < 0.0001, log-rank test for trend between curves p = 0.014).

