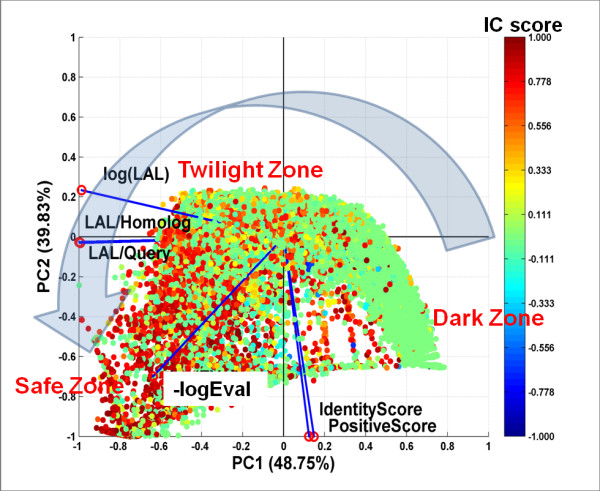
Figure 1.

Principal Component Analysis of Interface Conservation Scores and Sequence Alignment Statistics. Proteins in the Nr6505 and their homologs were analyzed. The data points in the biplot correspond to the projection of a 6-dimensional vector representing each protein-homolog onto a 2-dimensional space defined by the first and second principal components (PC1 and PC2). Blue lines with red circles at their tips represent the axes of the original 6-dimensional space for the 6 variables used in PCA analysis: -log(EVal), Identity Score, Positive Score, log(LAL), alignment length fractions (LAL/query length) and (LAL/homolog length). Each data point is colored according to its computed interface conservation (IC) score, with higher IC scores (red/orange) indicating higher interface conservation and lower IC scores (blue/green) indicating lower interface conservation (see text for details). The large gray arrow indicates the direction of increasing degree of interface conservation, from Dark to Twilight to Safe Zone.
