
Figure 2.
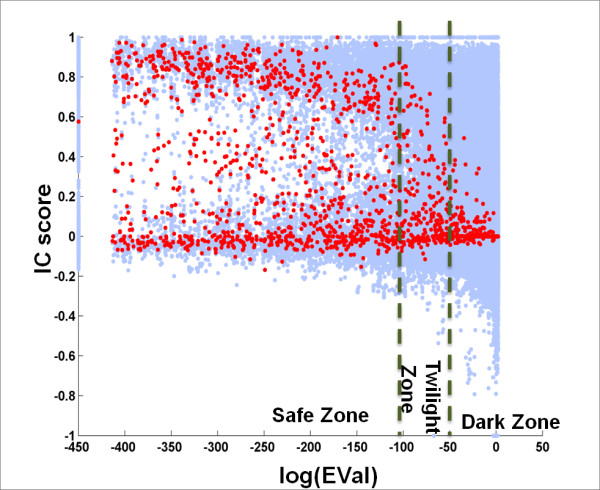
EVal is a Good Indicator of Interface Conservation. Each blue dot in the scatter plot corresponds to a query-homolog pair. Red dots are the median values of IC scores for a specific EVal. To avoid log(0), we set log(EVal) = -450 when EVal = 0.