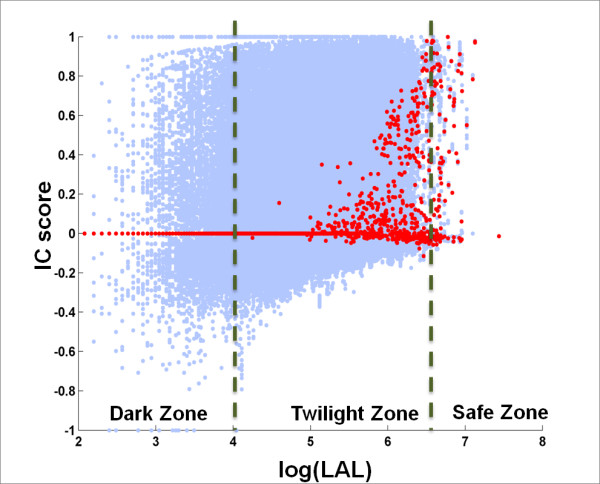
Figure 3.

Interface Conservation (IC) Scores are Linearly Related to the Log of the Local Alignment Score (LAL). Each blue dot in the scatter plot corresponds to a query-homolog pair. Red dots are the median values of IC scores for a specific LAL. Note the trend of increasing median IC score with log(LAL) observed with the transitions from Dark to Twilight to Safe Zone.
