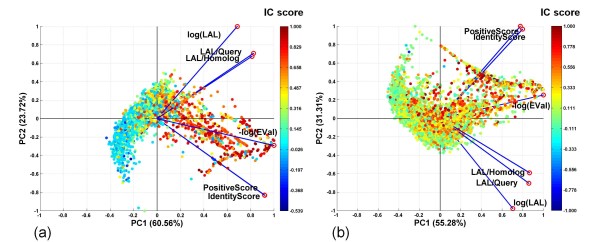
Figure 5.
Principal Component Analysis of Interface Conservation Scores and Sequence Alignment Statistics for Obligate versus Transient Complexes. The PCA biplots shown are for (a) proteins from obligate complexes and (b) proteins from transient complexes. Please see Figure 1 legend for additional details.

