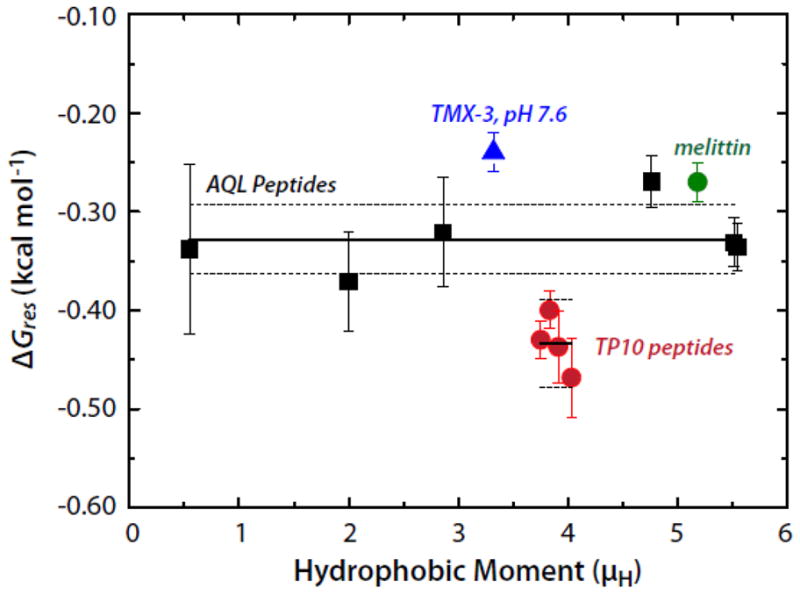
Figure 3.

The per-residue free energies of folding (ΔGres) of several peptides in the POPC membrane interface plotted as a function of the hydrophobic moment (μH). The Gibbs free energy of helix formation in the membrane interface as a function of hydrophobic moment for the AQL (solid black squares) and TP10 (solid red circles) families of peptides. Data for melittin and TMX-3 are shown as well (solid green circle and solid blue triangle, respectively). The solid and dotted lines superimposed on the AQL and TP10 data points represent the means and the standard errors of the means (SEMs), respectively. The mean ± SEM for AQL is −0.328±0.013 kcal mol−1; the values for the TP10 peptides are -0.434±0.014 kcal mol−1. The weighted mean of the AQL and TP10 data is −0.37±0.02 kcal mol−1. The values of ΔGres for the TP10 peptides were computed using the free energies and helicities reported by McKeown et al. [8].
