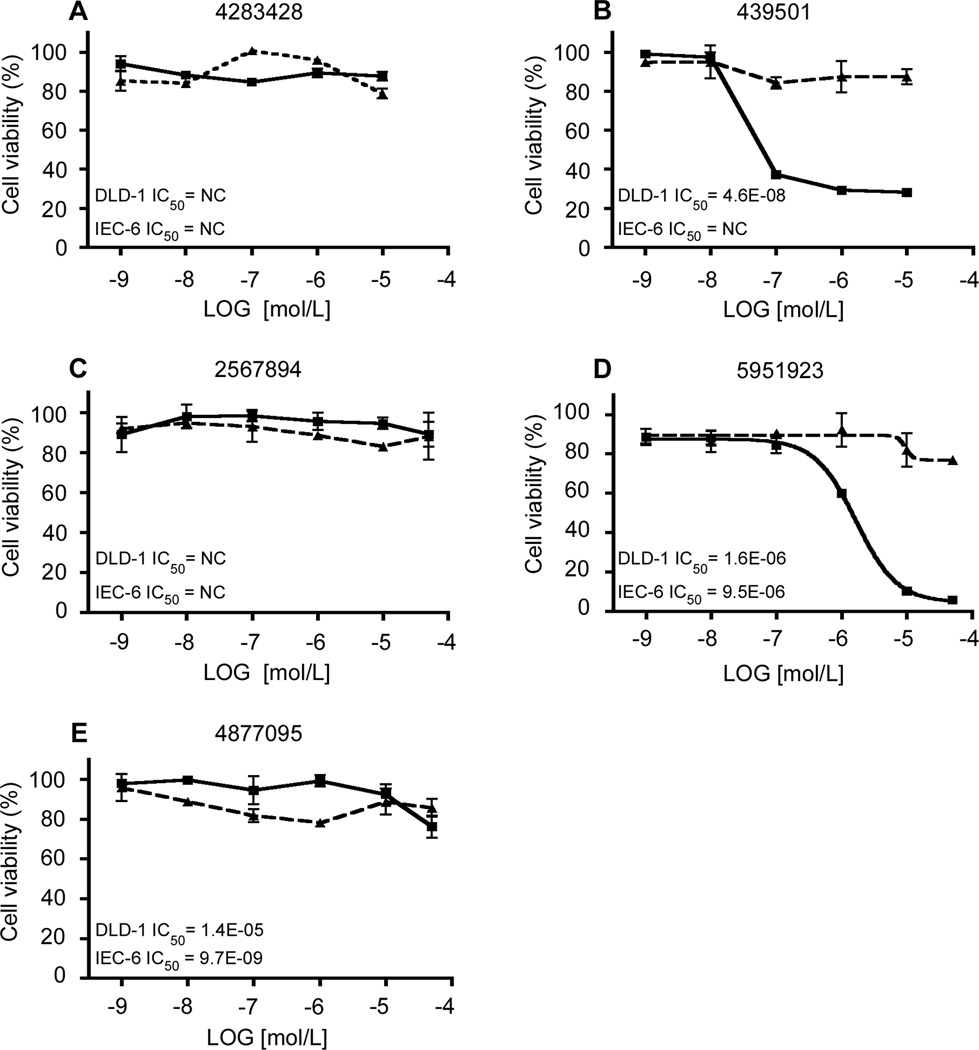
Figure 3.
Cell viability assays of DLD-1 and IEC-6 cells treated with the same compounds assayed in Figure 2. Cells were seeded in 96-well plates with medium containing DMSO or increasing concentrations of CIDs 4283428 (A), 439501 (B), 2567894 (C), 5951923 (D) and 4877095 (E), for 2 d before the measurement of luciferase activity with Cell-Titer Glo assays. The control (cells with medium containing only DMSO) was defined as 100% and the results from other measurements were calculated accordingly. IC50 was calculated for each compound, NC – not converged. Each experiment was performed in triplicates. DLD-1 – solid lines, IEC-6 – dashed lines.

