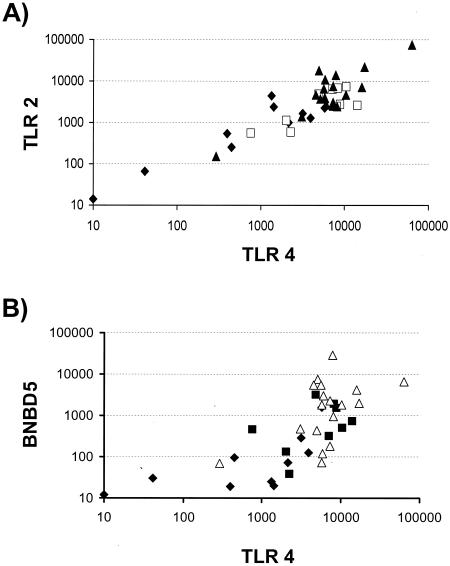
FIG. 4.
Correlated levels of TLR2, TLR4, and BNBD5 mRNA abundance. (A) Reciprocal plot of individual TLR2 and TLR4 copy numbers from healthy (carets), slight (squares), or moderately and severely (triangles) infected quarters. Filled symbols represent subgroups with P values of <0.05 as the level of significance for the correlation between both parameters. (B) Relationship between TLR4 and BNBD5 mRNA concentrations (symbols are as defined for panel A). A similar plot is obtained if the BNBD5 data are plotted against those for TLR2 (data not shown).

