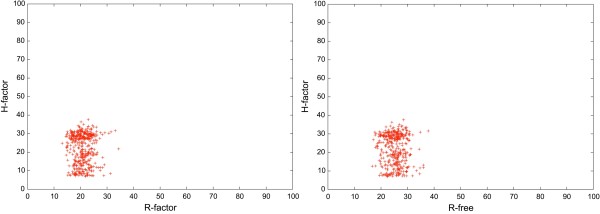
Figure 5.
Comparison between the H-Factor and the experimental R-factor and R-free. A set of 445 randomly chosen X-ray crystallography structures of 6 or more identical chains have been scored with the H-factor and results are compared to both the experimental R-Factors and R-Frees. R-values are scaled in the interval [0,100%] to allow for direct comparison. Note that we computed a H-factor only from functions (3) and (4) since scores (1) and (2) that are usually in the calculation of the H-factor are meaningless for this test set.

